
-
Diagnose performance problems using SQL Profiler and Performance Monitoring tool
-
Basic use of SQL Profiler
-
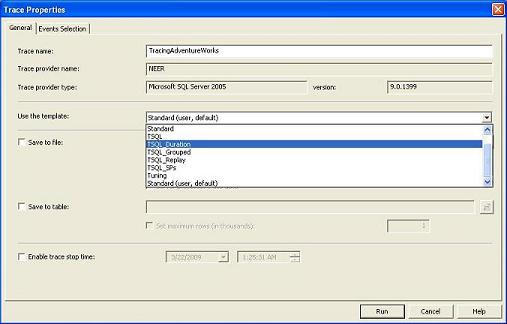
Launch the SQL Profiler (Tools->SQL Server Profiler in the Management Studio) and connect it to the desired SQL Server instance. Select a new trace to be created (File->New Trace) and select a trace template (a trace template is a template where some pre-selected events and columns are selected to be traced).
-
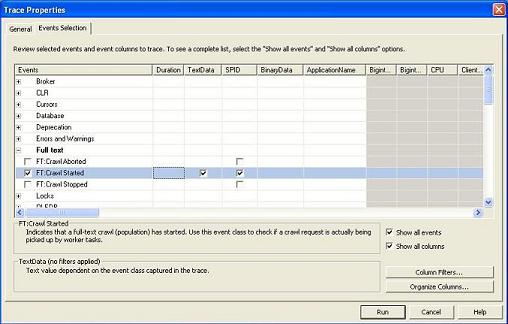
Or you can select particular events and select/deselect columns to specify the information you want to see in the trace output.
-
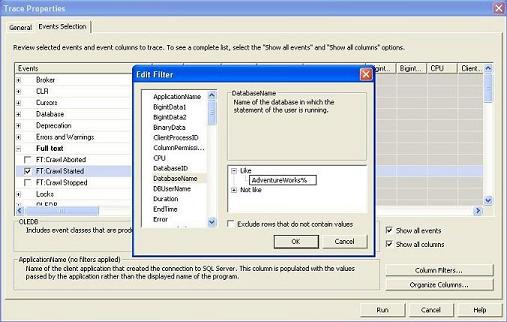
Or you can organize columns (click the Organize Columns button) to specify the order of their appearance in the trace. Also, specify column filter values to filter the event data which you are interested in. For example, click on the Column Filters and specify the database name value in the Like text box to trace events only for the specified database. Please note that, filtering is important because, SQL profiler would otherwise capture all unnecessary events and trace too many information that you might find difficult to deal with.
-
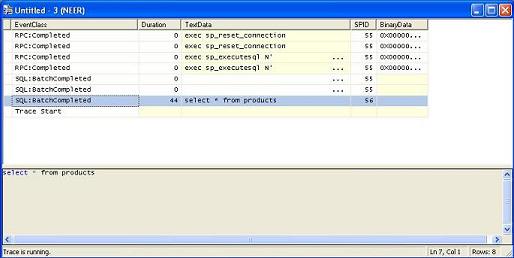
Run the profiler and wait for the events to be captured on the trace.
-
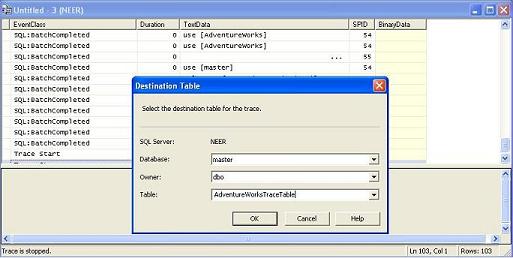
When enough information is traced, stop the profiler (by pressing the red Stop icon) and save the trace.
-
If the trace is saved on a table you can run a query to retrieve the expensive TSQL's using a query like this:
SELECT TextData, Duration, ...

FROM tableName

ORDER BY Duration DESC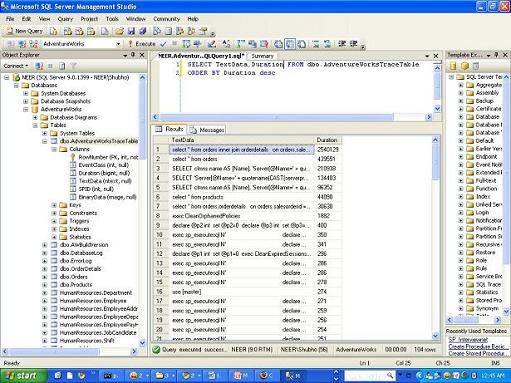
-
Launch the SQL Profiler (Tools->SQL Server Profiler in the Management Studio) and connect it to the desired SQL Server instance. Select a new trace to be created (File->New Trace) and select a trace template (a trace template is a template where some pre-selected events and columns are selected to be traced).
-
Effective use of SQL Profiler to troubleshot performance related problems
Usually SQL Profiler is used to trace the most expensive TSQLs/Stored Procedures. But, the tool is not limited to it. You can use many powerful features of this tool to diagnose and troubleshoot different kinds of problems that could occur due to many possible reasons.
When you are running the SQL Profiler, there are two possibilities. Either you have a reported performance related issue that you need to diagnose or you need to diagnose any possible performance issue in advance so that you can make sure your system would perform fast in the production after deployment.
Here are some tips you may use:
-
Create your own template when needed
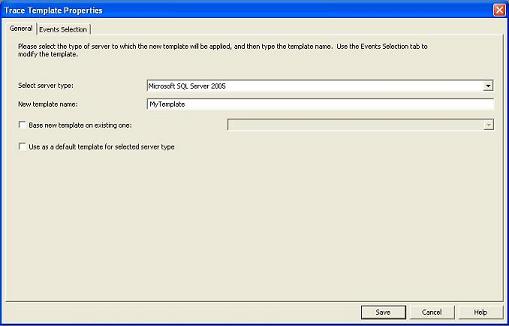
Usually the existing templates will serve your needs, but there may be situations when you will need a customized template for diagnosing a specific kind of problem in the database server (for example deadlock occurring in the production server). In this case you can create a customized template using File->Templates->New Template and specifying the Template name, events and columns. Also you can select an existing template and modify it according to your needs.
-
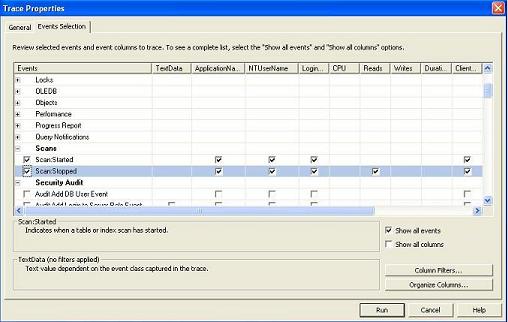
Capture TableScan or DeadLock events
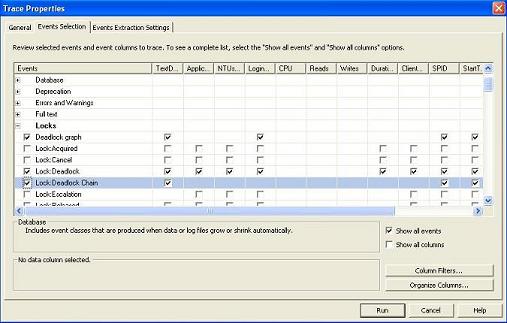
With SQL Profiler you can edit the templates so that, the profiler listens for any Table scan or deadlock event that might take place in the database. To do this, check the Deadlock Graph, Deadlock and DeadLock chain events in the DeadLock section while creating/editing the tracing template. Then start the profiler and run your application. Sooner or later, when any table scan or deadlock occurs in the database, the corresponding events would be captured in the profiler trace and you would be able to find out the corresponding TSQLs that are responsible for the above described situation.
Note: You can also require the SQL Server log file to write deadlock events so that you can get important context information from the log when the deadlock took place. This is important because sometimes you need to combine the SQL Server deadlock trace information with that of the SQL Server log file to detect the involved database objects and TSQLs that are causing deadlocks.
Detecting Table scan:
Detecting Deadlocks:
-
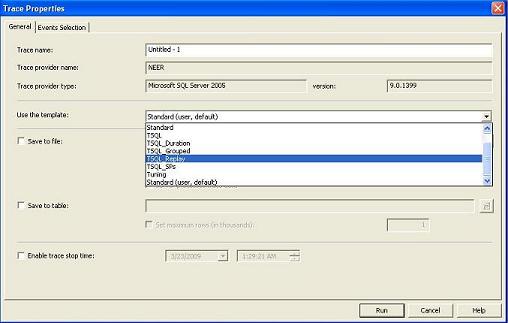
Create Replay trace
In order to troubleshoot any performance problem in the production database server, you need to try to simulate the same environment in your test server first so that the performance problem can be re-generated. The SQL Profiler tool lets you do this by using a Replay trace. You can use a TSQL_Replay Trace template to capture events in the production server and save that trace in a .trace file. Then you can replay the trace on test server to re-generate and diagnose problems.
For more info check this
-
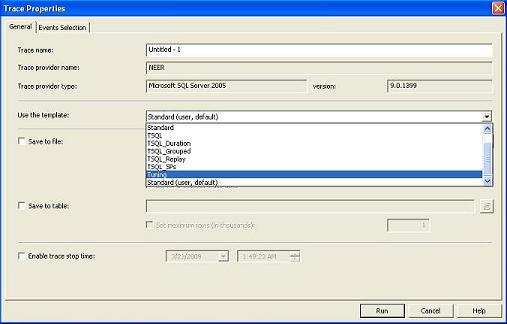
Create Tuning trace
The Database Tuning Advisor is a tool that can give you good tuning suggestions to enhance your database performance. But to get a good and realistic suggestion, you need to provide the tool with appropriate load that is similar to the production environment. So, you need to execute the same set of TSQL's and open the same number of concurrent connections in the test server and then run the tuning advisor there. The SQL Profiler lets you capture the appropriate set of events and columns (for creating load in the tuning advisor tool) by the Tuning template. Run the profiler using the Tuning template, capture the traces and save it. Then use the tuning trace file for creating load in the test server by using the Tuning advisor tool.
For more info check this
-
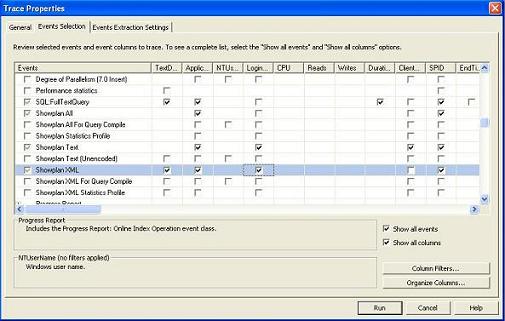
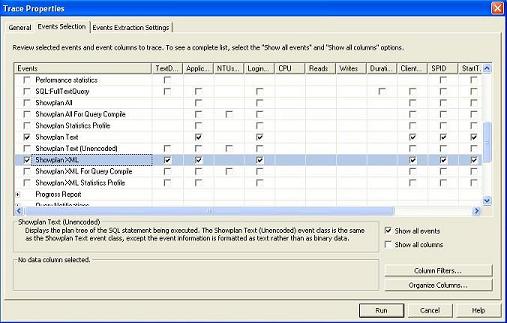
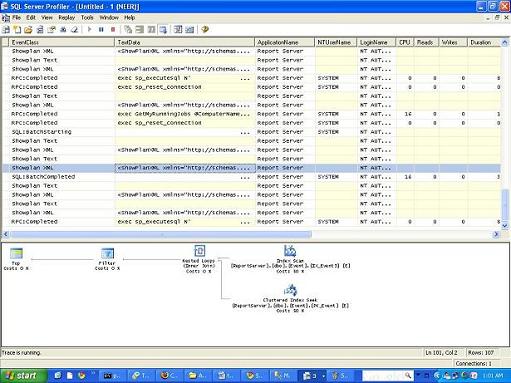
Capture ShowPlan to include SQL execution plans in the profiler
Sometimes the same query give different performance in the Production and Test server. In this case you will have to take a look at the execution plan that is being used in the Production server for executing the actual Query. But you just can't run the TSQL that is causing performance problem in the production server to view the actual execution plan for lots of reasons as being that this execution plan might not reflect you the true execution plan that is used in reality in a fully loaded production database. The SQL Profiler can help you in this regard. You can include ShowPlan or ShowPlan XML in your trace while profiling in the Production server. This would capture SQL plans along with the TSQL text while tracing. Do this in the test server too and analyze and compare both execution plans to find out the difference in them very easily.
Specifying Execution plans to be included in the trace
Execution plan in the profiler trace
-
Create your own template when needed
-
Basic use of SQL Profiler
Posted At : Jan 08, 2010 15:20 PM
| Posted By : Ed Tabara
Related Categories: SQL
Related Categories: SQL
| 6701 Views
| 8% / 0% Popularity
Comments